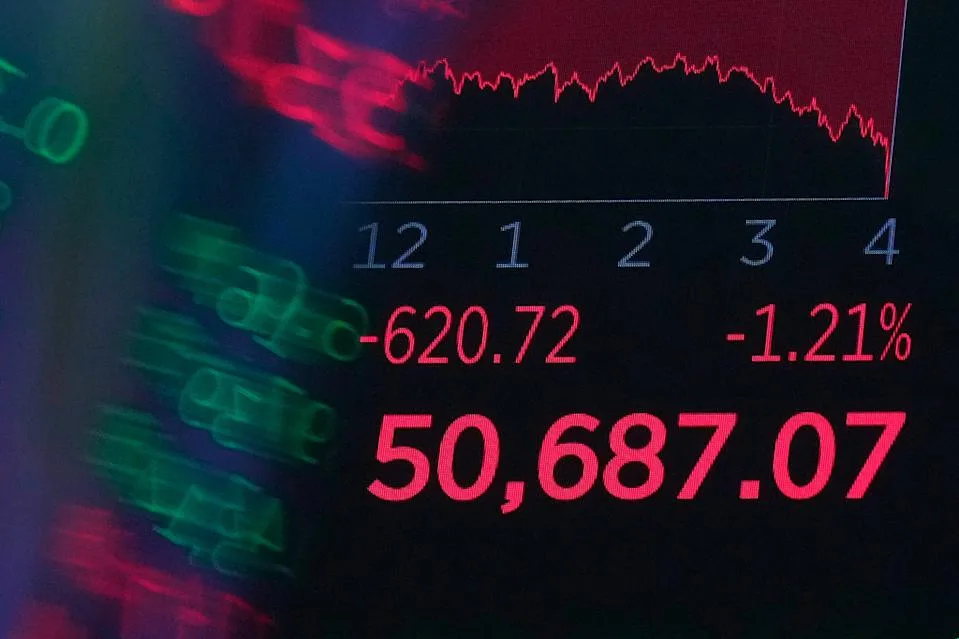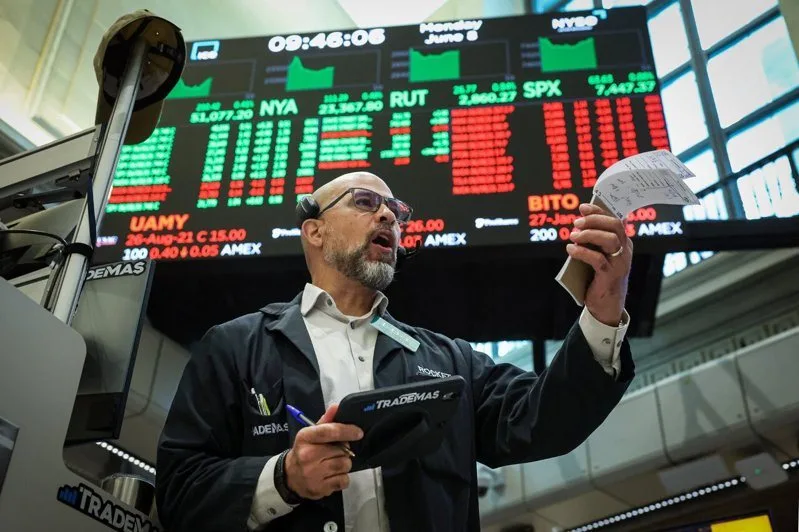
Bank of America Securities reported that approximately 70% of bear market warning signals for the US stock market have been triggered. This level matches those seen at historical market tops, signaling heightened risk of a correction or downturn [1, 2, 3, 4, 5, 6].
Among 20 key measurement indicators for the S&P 500, 17 are significantly elevated, with 8 exceeding the bubble peak levels recorded during the 2000 dot-com crash. The index is currently overvalued, showing large valuation gaps between high and low price-to-earnings stocks. This points to excessive speculation, particularly within the technology sector [1, 2, 3, 5, 6].
The performance gap between the best and worst 20% of tech stocks is the widest since February 2000. The top tech stocks have delivered a median 3-month gain of nearly 110%, a pattern resembling the dot-com bubble peak. Bank of America strategist Savita Subramanian said, “The strong performance gap between the best and worst 20% technology stocks is the largest since February 2000, signaling extreme speculation” [1, 3, 4, 5, 6].
Subramanian advised investors to "take profits and not chase broad indices blindly, focusing instead on select stocks," highlighting caution amid overheated valuations [1].
Several internal signs also warn of market instability, including stagnated cash flow conversion, increased supply of investment-grade bonds and stocks, declining share buybacks, and hyperscalers’ capital expenditure to operating cash flow ratio rising from 40% in 2023 to near 100% by year-end 2026 [1, 3, 4, 5, 6].
Macquarie Bank strategist Viktor Shvets added that multiple valuation metrics are at historic highs. He noted the US stock market’s valuation relative to GDP stands near record levels of 2.5 to 3 times, with the Shiller CAPE ratio around 42, about twice the postwar average and surpassed only during the dot-com bubble peak. The top 10 S&P 500 stocks now represent over 40% of total market capitalization, a modern record. Shvets warned, “Stock valuations appear very high, and a U.S. equity bubble at historic proportions is underway. Its burst would affect global assets severely” [7].
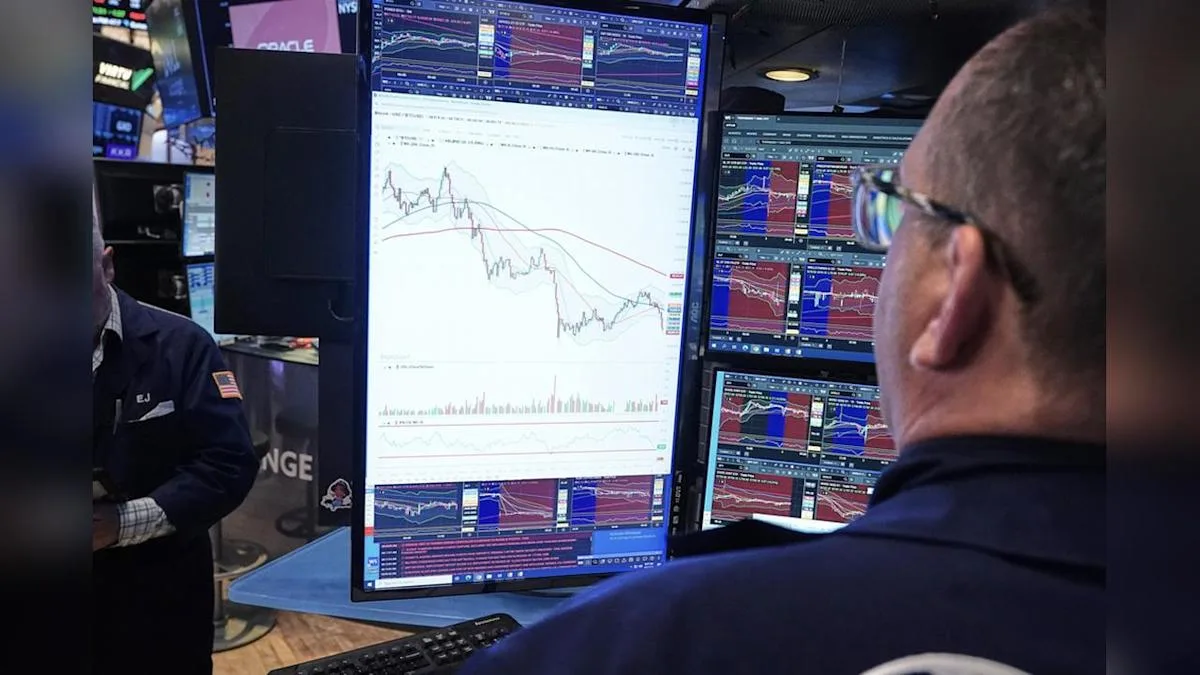
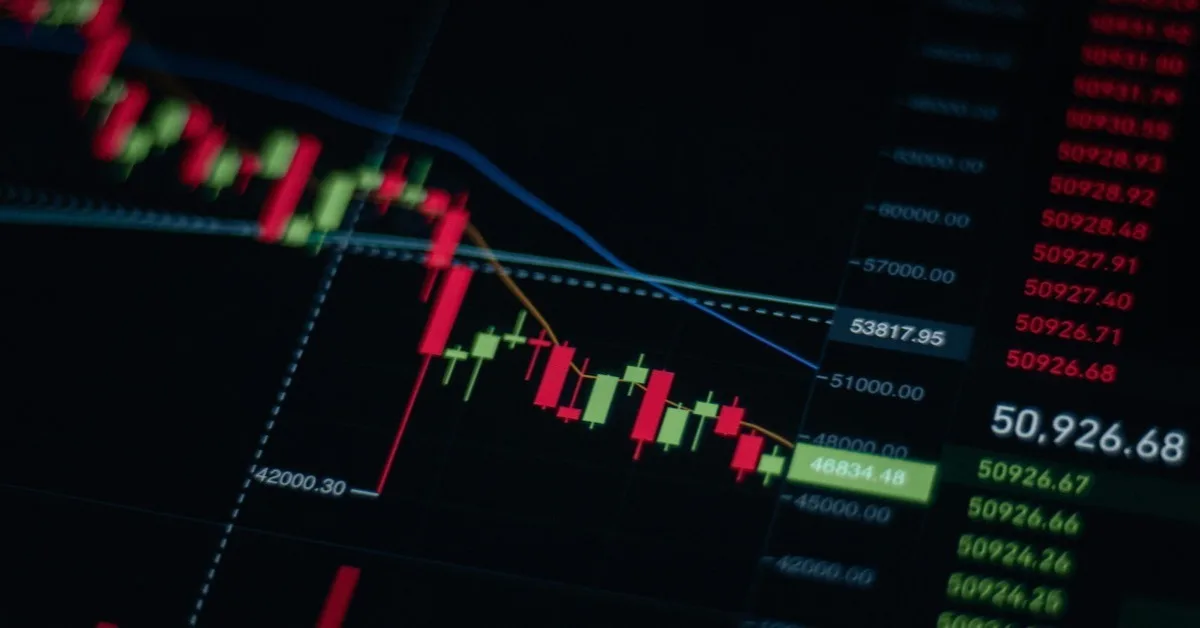
The recent US stock market correction intensified on August 5, 2026, with the Philadelphia Semiconductor Index plunging more than 10%, sparking panic in Asian markets. Taiwan’s stock market experienced a severe drop of 1,568.16 points (3.48%) on August 8, the third largest in its history, amid fears of Fed rate hikes and selling pressure in tech and semiconductor shares [3, 7, 4, 5, 6]. Taiwan rebounded strongly the next day, rising over 1,200 points to regain key levels despite ongoing volatility [4, 5, 6].
Despite volatility, some strategists advocated buying on dips and holding diversified portfolios, stressing that the correction reflected a healthy market adjustment rather than fundamental collapse [3, 7, 4, 5].
Bank of America set a year-end target for the S&P 500 around 7,100 points, implying a downside risk of about 4% to 4.5% from the then-current level near 7,405 points [1, 2, 3, 4, 5, 6].